Unlock insights, drive action, revolutionize retail. Xylity makes data work for you. Our BI & Analytics transform logistics, powering your retail growth.
Maximize Sales Performance with Precise Analytics
Understanding your sales performance is crucial to making smart retail decisions. With Xylity, gain an accurate, real-time view of sales metrics across every dimension:
Product Sales Analytics
- Track revenue and units sold for every product
- Spot high/low performers by category, brand, SKU
- Identify patterns related to seasonality, discounts, new launches
- Optimize pricing, promotions, inventory for profitability
Regional Sales Analytics
- Track sales by neighborhood, city, state, country
- Identify your highest and lowest growth geographies
- Focus marketing efforts on high-potential regions
- Determine optimal locations for new store openings
Channel Sales Analytics
- Track sales across channels – in-store, online, mobile, catalog
- Identify the strongest sales channels for different products
- Optimize channel promotion strategies and inventory allocation
Customer Segment Sales Analytics
- Analyze sales performance for every customer segment
- Focus on your most valuable segments for growth opportunities
- Personalize engagement for profitability of high-lifetime-value segments
Xylity makes sales analytics effortless with AI-powered data modeling, interactive dashboards, and drill-down capabilities. Our advanced forecasting algorithms detect patterns and predict future trends. Access accurate sales insights customized to your business needs. Rally your teams around a shared view of retail performance truth.
Here are a few ways Xylity’s sales analytics solution helps retailers optimize pricing and promotions:
Price Elasticity Analysis
- Xylity analyzes historical sales data to determine price elasticity for different products. This reveals how demand responds to price changes.
- With this insight, retailers can set optimal prices to maximize revenue. Products with elastic demand can have lower prices to drive volume, while inelastic products can sustain higher prices.
Promotion Impact Analysis
- Xylity tracks sales before, during and after promotions. This quantifies the incremental lift generated by discounts, coupons, etc.
- Retailers can focus promotions on the most responsive segments and tailor promotion depths to optimize results.
Regional Pricing Optimization
- Xylity provides pricing analytics at a granular geographic level based on local demand patterns and competitive factors.
- This allows retailers to localize pricing based on micro-markets rather than using one-size-fits-all national pricing.
Role-Based Pricing
- Xylity analyzes customer segments to determine their price sensitivities and willingness to pay.
- Retailers can then do targeted price segmentation rather than mass discounting to maximize revenues.
Using these advanced analytics capabilities, retailers can employ strategic, data-driven pricing and promotion strategies to boost profitability. Xylity empowers sound retail pricing decisions.
Hyper-Personalize the Retail Experience
Today’s customers expect personalized engagement tailored to their preferences and behavior. With Xylity, uncover detailed customer intelligence to deliver individualized retail experiences.
Our AI-powered customer analytics provide complete visibility into
- Demographics like age, gender, location
- Psychographics such as interests, values, personality
- Purchase history across channels
- Brand engagement and loyalty
Key capabilities
- Micro-segmentation to define high-value customer cohorts
- Lifetime value estimation to focus retention efforts
- Propensity modeling to predict purchase behavior
- Next-best offer recommendation based on customer profile
- Omnichannel journey mapping to optimize engagement
Armed with Xylity’s customer analytics, retailers can hyper-personalize marketing campaigns, promotions, recommendations, and services. Deliver outstanding personalized experiences at scale to earn customer loyalty and drive revenue growth.
Optimize Inventory for Maximum Profitability
Efficient inventory management is vital for retail success. With Xylity, make data-backed decisions to optimize stock levels and minimize waste.
Monitor inventory in real-time with
- Visibility into inventory across all stores, warehouses, in-transit
- Automated alerts on low stock based on replenishment thresholds
- Identification of fast/slow moving items by sales velocity metrics
Our predictive analytics capabilities allow retailers to
- Forecast demand by product based on past sales, seasonality, trends
- Optimize stock levels to align with demand forecasts
- Minimize out-of-stocks through safety stock optimization
Additional inventory analytics help retailers to
- Identify obsolete/excess inventory for timely liquidation
- Analyze inventory turnover by product/category
- Calculate weeks of supply for smarter replenishment
Our user-friendly inventory dashboards surface insights like
- Out-of-stock percentage
- Dead stock as % of total stock
- Lost sales due to lack of inventory
With Xylity, retailers gain the inventory intelligence needed to improve profitability. Optimization of inventory levels reduces waste while maximizing service levels and sales.
Here is an explanation of how Xylity’s inventory dashboards calculate the percentage of dead stock:
Dead stock refers to inventory that is obsolete, expired, damaged, or unsellable for any reason. Having excessive dead stock takes up physical and financial resources that could be better utilized.
Xylity’s inventory dashboards calculate dead stock percentage using the following method:
Identify the total quantity of dead stock across all inventory locations based on stock keeping unit (SKU) data. This includes:
- Expired or short-dated products
- Damaged, defective, or recalled products
- Discontinued or obsolete products
Identify the total quantity of saleable stock across all inventory locations based on SKU data. This excludes dead stock.
Divide the quantity of dead stock by the total quantity of stock (dead + saleable) and multiply by 100 to arrive at dead stock percentage.
For example, if a retailer has 2,000 units of dead stock and 10,000 units of saleable stock, the dead stock percentage would be:
Dead stock percentage = (Dead stock/Total stock) x 100
= (2,000/12,000) x 100
= 16.67%
Xylity’s inventory dashboards automatically calculate this metric and make it visible, allowing retailers to track dead stock levels and take corrective actions to reduce wastage and write-offs. The dashboard displays dead stock percentage by product category, brand, and location to fine-tune inventory management decisions.
Skyrocket Sales with Real-Time Data
How Retail Dashboards Unlock Higher Performance
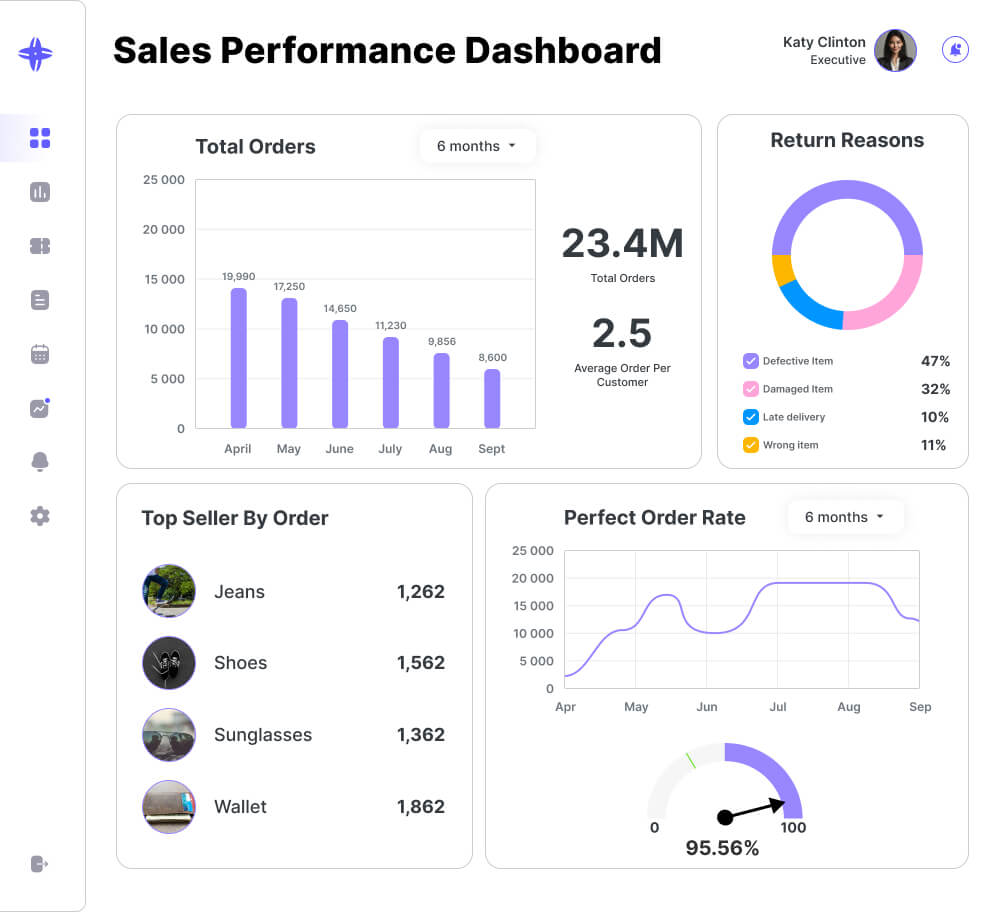
The Retail Sales Performance Dashboard. Your eagle eye on revenue growth.
Understanding sales and operational performance is crucial for retailers. Our intuitive retail dashboards provide real-time analytics so you can make better business decisions.
With our dashboards, you can:
Analyze Returns:
View return reasons using pie charts. Identify problem areas like defective items to reduce returns.
Track Order Accuracy:
Monitor perfect order rates over time via line graphs. Improve fulfillment processes to drive on-time, complete delivery.
Follow Sales Trends:
Use bar graphs to see total order volumes and compare to targets. Forecast demand more accurately.
Check Performance:
Gauge sales achievement against goals. Quickly identify periods of excellent or poor performance.
Identify Top Sellers:
Rank top selling products using tables. Optimize inventory and marketing for the most profitable items.
Make Data-Driven Decisions:
Backed by analytics, adjust operations, inventory, marketing, and more to maximize success.
Know Your Customers. Outmaneuver Your Competition
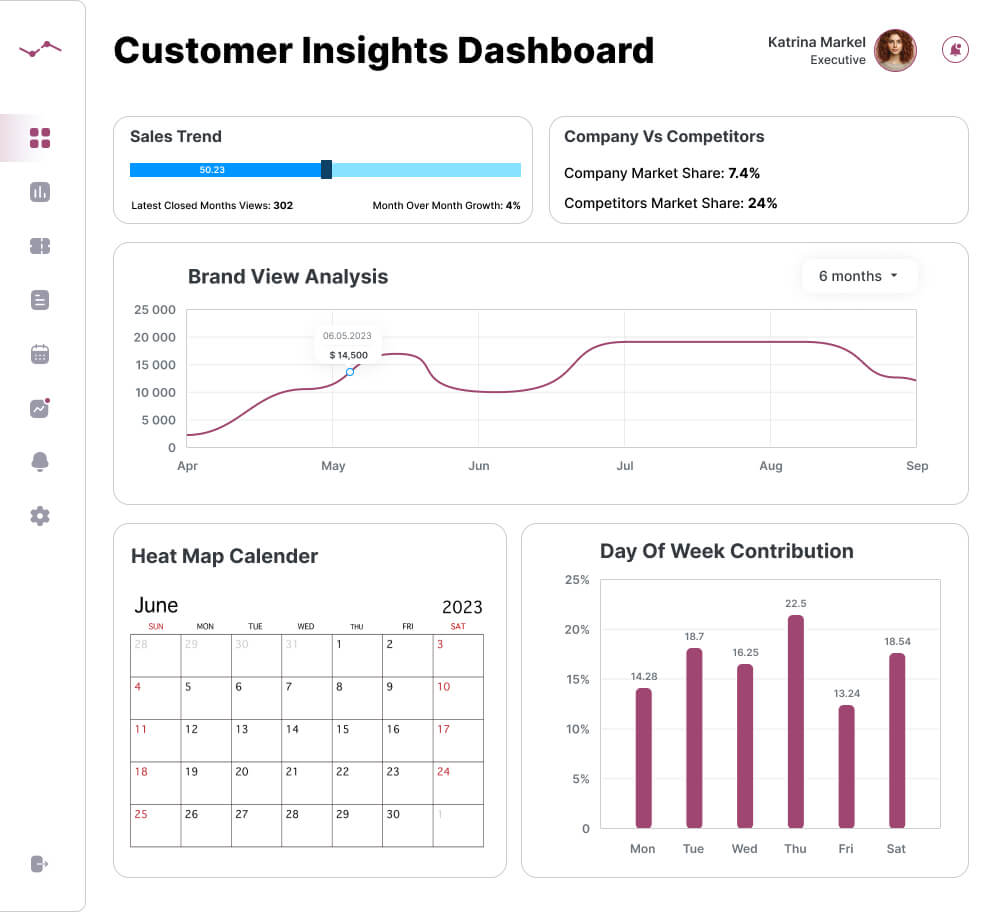
The Customer Insights Dashboard. Your key to anticipate buyer needs.
Demographics. Purchase history. Preferences. This high-flying overview reveals crucial customer intel:
Track Sales Trends:
Follow revenue patterns over time. Quickly spot periods of peak performance to guide forecasting.
See Latest Releases:
Monitor performance of new collections and releases. Identify your most successful launches.
Measure Growth:
Use graphs to compare month-over-month and year-over-year sales growth percentages. Set realistic targets.
Compare Market Share:
Visualize your market share versus competitors. Identify areas to gain ground.
Analyze Brand Health:
Monitor brand views and engagement metrics. Optimize areas like social media, ads, and influencers accordingly.
Improve Store Planning:
See day-of-week sales patterns. Adjust staffing levels and operations to match customer traffic flows.
Identify Opportunities:
With a comprehensive view of retail performance, adjust strategies and unlock growth potential.
Inventory Done Right. More Profits In-Flight
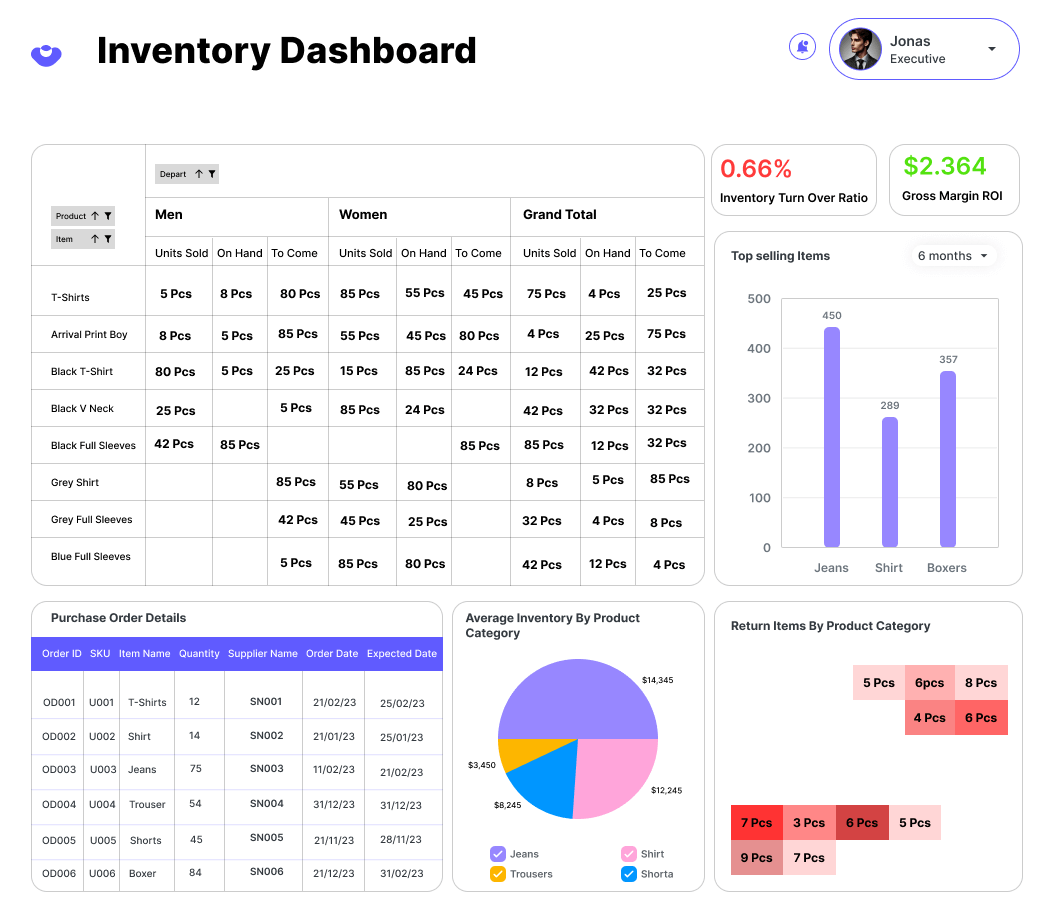
Managing inventory efficiently is key for retail success. Our intuitive inventory dashboards provide real-time analytics so you can make data-driven decisions.
With our dashboards, you can:
Check Stock Levels:
View availability by product and department using tables. Identify low stock to prevent shortages.
Track Purchase Orders:
Follow order details closely in tables. Ensure on-time delivery.
Analyze ROI:
Monitor gross margin ROI over time with line charts. Optimize profitable products.
Identify Top Sellers:
Use bar charts to rank bestselling items. Prioritize inventory for high-performers.
Assess Returns:
Bar graphs show returned items by category. Reduce defects and improve quality.
Evaluate Inventory Mix:
See product category breakdowns via pie chart. Adjust mix based on sales trends.
Improve Turnover:
Line graphs help track and compare turnover ratios over time. Reduce excess stock.
With end-to-end visibility into your marketing funnel, you can drive growth and demonstrate ROI.
With real-time visibility into inventory metrics, you can increase efficiency, minimize costs, and boost customer satisfaction.
Target Marketing ROI That Soars
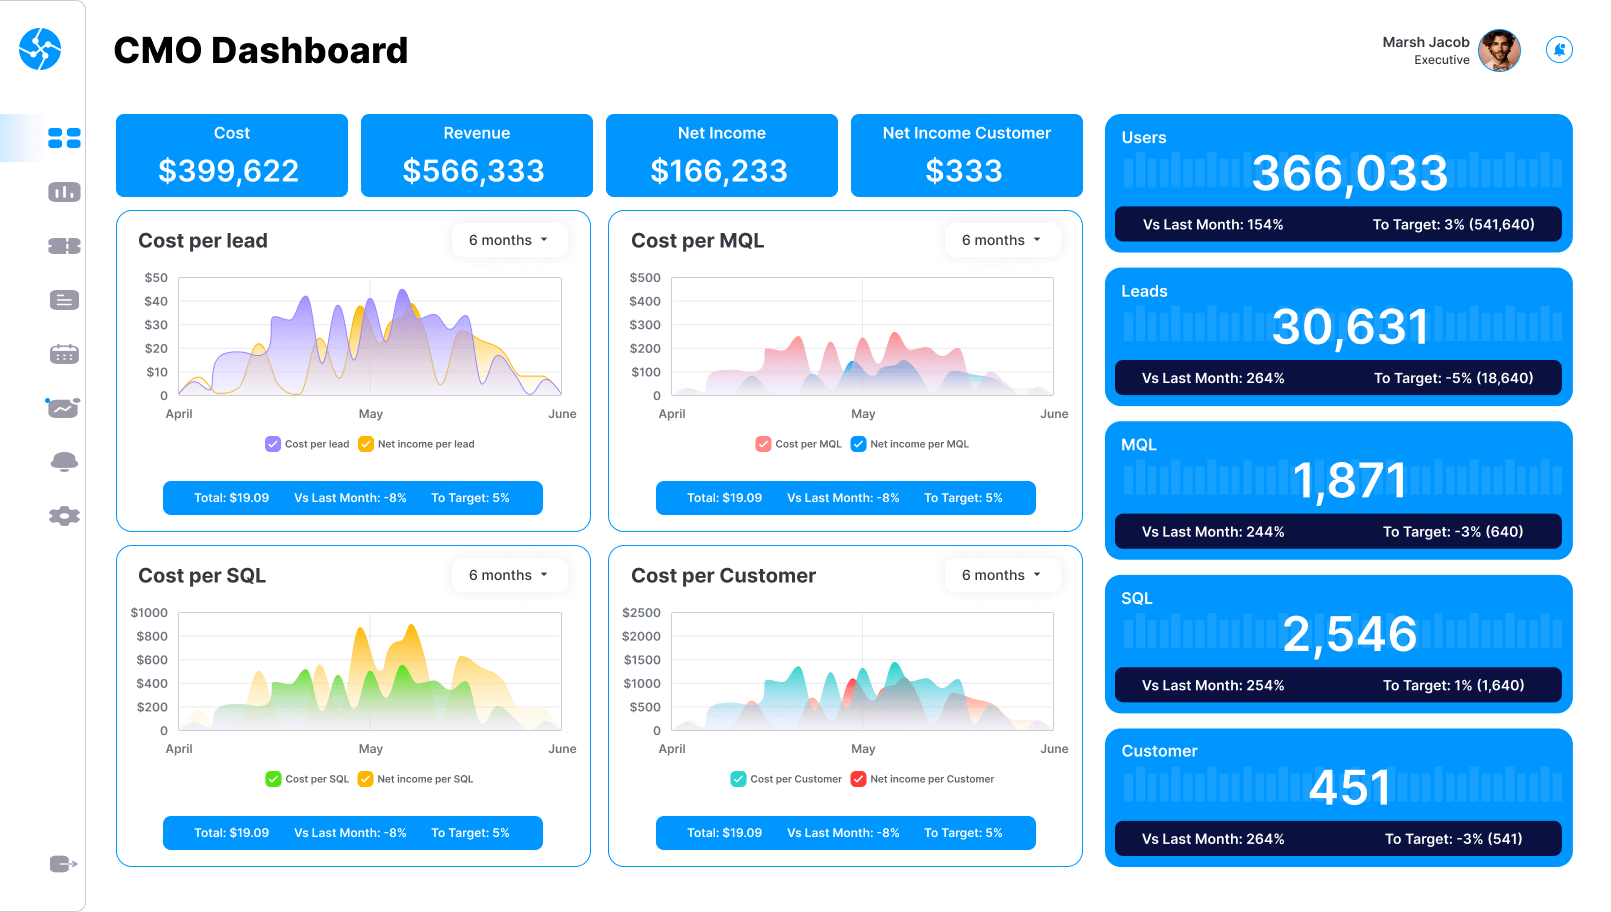
The Marketing Performance Dashboard. Your insider metrics for campaigns that convert.
Measure marketing effectiveness across every channel. Identify high-flyers and dropouts with:
Track Lead Costs:
Monitor cost per lead over time. Identify most and least efficient channels.
Analyze Spend:
Relate total spend to leads, MQLs, SQLs and customers. Focus budget on best performing sources.
Measure New Leads:
Use graphs to view new MQL trends. Set realistic goals based on past performance.
Track Conversion Rates:
Follow users to leads, MQLs, SQLs and customers. Identify and resolve bottlenecks.
Forecast Accurately:
With historical data, predict future lead volumes and budget needs more precisely.
Identify Opportunities:
Spot trends and optimize underperforming areas like channels, campaigns, and assets.
Streamline Operations. Send Profits Soaring
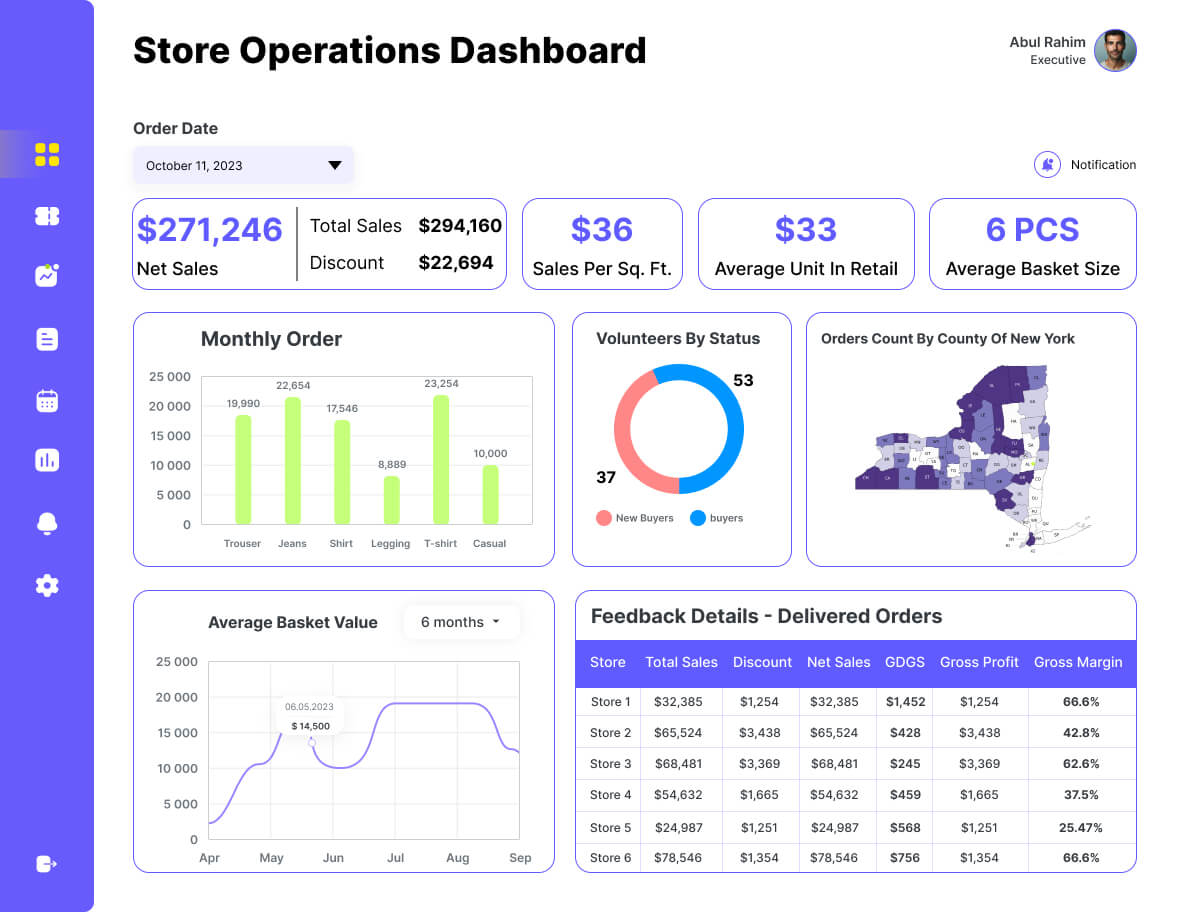
The Store Operations Dashboard. Your overview to spot bottlenecks and boost efficiency.
Making smart business decisions requires data-driven insights. Our intuitive store dashboards give you an all-encompassing view of operations so you can optimize performance.
Monitor Critical Metrics at a Glance
- Track sales and revenue across every product category using easy-to-read tables.
- Break down profitability by department with color-coded bar charts. Identify winners and losers.
- Map regional sales volumes to uncover best and worst performing locations.
- See customer traffic patterns through visual visitor count dashboards. Match staffing to busy times.
- Follow average purchase size over time with line graphs. Spot trends and opportunities.
Make Informed Strategic Decisions
With comprehensive store analytics, you can pinpoint areas for improvement and growth. Our powerful dashboards give you the visibility you need to:
- Adjust category merchandising and promotions based on sales data
- Optimize staffing levels by store location and time of day
- Identify regional expansion opportunities
- Test new initiatives to increase average order value
Monitor in real-time:
- Sales per square foot
- Customer satisfaction
- Employee turnover
Use it to smooth operations storewide. Pinpoint problem areas. Remove obstacles. And keep your business soaring smoothly.
Let Xylity empower your retail logistics.
Total Visibility for Your Entire Supply Chain
Get a panoramic view of your complex retail supply chain with Xylity. Our analytics spotlight key processes so you can optimize every link.
Procurement
- Supplier scorecards track quality, cost, delivery against benchmarks
- Spend cube analysis breaks down purchasing by multiple dimensions
- Supplier segmentation identifies high/low cost sources by product category
Logistics
KPI tracking for
- On-time deliveries
- Transport costs
- Carbon emissions
Allows optimization of
- Delivery routes
- Load consolidation
- Fleet utilization
Warehousing
- Labor productivity metrics
- Inventory accuracy rates
- Demand forecasting engine
Gain visibility to
- Rightsize workforce
- Improve inventory turns
- Manage seasonal variability
With end-to-end supply chain visibility, retailers can identify issues, control costs, and collaborate better with partners. Xylity illuminates your entire supply network.
Pinpoint Your Best Retail Sites
Looking to expand? Let Xylity’s location analytics guide your site selection process.
Interactive Dashboards
Visualize crucial location factors on dynamic geospatial maps
- Heat maps of demand drivers like demographics and income
- Gaps and white spaces indicating areas for expansion
- Locations of current stores and competitors
Predictive Capabilities
Leverage advanced analytics to:
- Score and rank potential new sites
- Forecast sales for site options
- Model impact of new locations on existing stores
Optimization for Current Stores
Our analytics also help optimize your current fleet:
- Define locally tailored product assortment
- Benchmark stores and identify best/worst performers
- Provide renovation and redesign recommendations
With these location intelligence capabilities
Retailers gain strategic insights to:
- Select winning new sites
- Enhance existing store productivity
- Confidently expand geographic footprint
Here are a few key ways Xylity’s location analytics helps retailers select winning new sites:
Demand Forecasting
Xylity analyzes demographic, psychographic, and purchase behavior data to quantify demand potential for geographic areas. This highlights high-demand zones optimal for new stores.
Site Attribute Modeling
Xylity evaluates attributes like traffic patterns, anchor tenants, parking, and visibility to score potential sites. Sites with the optimal mix of attributes are more likely to be successful.
Cannibalization Analysis
Xylity models the impact new locations will have on sales at existing nearby stores. This avoids selecting sites that will just cannibalize current sales.
Sales Estimation
Using advanced analytics, Xylity forecasts the potential sales for proposed new sites based on correlated existing locations. This predicts revenue potential.
With these predictive capabilities, retailers can objectively evaluate options and identify locations that have the best chance of driving traffic, generating sales, and operating profitably. This takes the guesswork out of site selection. Xylity armbs retailers with location intelligence to pick winning new store locations.
Merchandising Analytics
Optimize Your Product Mix for Maximum Sales
Get product assortments right with Xylity’s merchandising analytics. Our solutions empower retailers to tailor product selection and placement for each location.
Assortment Optimization
- Analyze sales velocity by item to identify high/low performers
- Use association rules to determine which products boost basket size
- Localize planograms based on regional consumer preferences
Shelf Space Optimization
- Utilize planogram templates for efficient store sets
- Model changes in shelf space allocation
- Identify shelf layouts that maximize sales per square foot
Inventory Performance
- Calculate stock turns by category to identify bottlenecks
- Analyze weeks of supply to rightsize inventory
- Identify obsolete items for liquidation
With data-backed merchandising intelligence, retailers can:
- Define product mix by location
- Design optimal shelf layouts
- Improve inventory turns
Marketing Analytics
Laser Focus Your Marketing Strategy
Xylity provides marketing analytics to optimize your retail marketing mix across every channel:
Omnichannel Analytics Dashboard
- Spend, impressions, clicks, conversions for each channel
- Benchmark channel cost and performance metrics
- Interactively filter data for analysis
Attribution Modeling
- Quantify impact of each channel on customer journey
- Identify highest value channels to optimize budget
Marketing Testing
- A/B test email subject lines, social ad creatives
- Evaluate performance of various promotions
- Continuously refine strategy
With these capabilities, retailers can
- Measure campaign effectiveness
- Attribute sales to channels
- Align marketing spend with ROI
Gain the analytics edge to maximize your marketing ROI. Xylity provides the metrics and insights to deliver game-changing retail marketing results.
Xylity uses a variety of data to help retailers optimize their marketing spend and align it with ROI:
Campaign cost data – Budget and actual spend for each marketing campaign across channels like PPC, social, TV, email.
Campaign performance data – Impressions, clicks, conversions, revenue, profit for each campaign. Captured at channel and tactic levels.
Attribution data – Quantifies the impact each marketing channel has on conversions across the customer journey. Identifies high-value channels.
A/B testing data – Results from controlled experiments testing variations of marketing creatives, offers, pricing. Identifies optimal approaches.
Acquisition data – Customer acquisition cost metrics by channel, such as CPA and CAC. Allows comparison of channel profitability.
Lifetime value data – Expected lifetime revenue generated per acquired customer. Allows determination of acceptable CPA thresholds.
By analyzing these data sets, Xylity provides insight on:
- The efficiency of spending in each channel
- Which channels deliver the highest ROI
- The optimal budget allocation across channels
- How to maximize results for each $ spent
This enables retailers to continuously optimize their marketing mix and shift budgets towards high-ROI channels and campaigns. Xylity provides the actionable analytics retailers need to optimize marketing return on investment.
Store Operations Analytics
Unlock Your Stores' Full Potential
Get a true picture of store performance with Xylity’s operations analytics. Our intelligent dashboards spotlight:
- Sales per square foot – Monitor revenue efficiency of retail space
- Conversion rate – Evaluate store’s ability to convert shoppers to buyers
- Transaction size – Track average order value over time
- Inventory turns – Analyze how quickly shelf stock sells through
- Labor costs – Keep staffing costs in line with store productivity
Robust benchmarking capabilities allow retailers to:
- Compare similar format stores across the chain
- Identify best and worst performers
- Uncover strengths and improvement areas
Prescriptive analytics then provide:
- Customized recommendations to underperforming locations
- Store redesign guidance based on top performers
- Remerchandising advice tailored to each store
With Xylity, optimize your retail network’s profitability armed with data-driven store operations intelligence.
Fraud Detection
Shut the Door on Retail Fraud
Retail fraud drains profits. With Xylity’s AI-powered fraud analytics, slam the door shut.
- Predictive Models – Machine learning detects emerging fraud patterns, stopping crimes in real-time.
- Fraud Database – Global watchlists identify known offenders to block and monitor.
- Behavior Analysis – Profiles normal behavior to flag anomalies indicative of fraud.
- Risk Scoring – Calculates customer risk scores using advanced algorithms.
- Case Management – Workflow tools speed investigation and response.
Our fraud analytics also provide
- Chargeback analysis – Identifies fraud-prone products.
- Location analysis – Highlights fraud hotspots.
- Channel analysis – Detects channels requiring fraud prevention focus.
With robust protection, retailers can
- Prevent fraudulent transactions.
- Reduce chargebacks and fines.
- Cut investigation costs.
Stop fraudsters in their tracks. Xylity provides state-of-the-art retail fraud analytics.
Xylity
Your Data's Best Friend!
We Keep Your Data Safe with Security and Compliance
It’s 2023. Data security is paramount. At Xylity, we don’t take it lightly. We embrace advanced security measures:
Data Encryption
Your data, scrambled into unreadable code.
Secure Access Controls
Only authorized users get access.
Regulation Compliance
GDPR, CCPA – we’ve got your back.
But we don’t stop at security. Xylity helps you stay compliant. We understand data protection regulations. We ensure your retail business is always on the right side of the law.
Sleep easy. Your data is in safe hands.
Xylity
Your Partner from Day One!
Getting started with a new technology can be daunting. But not with Xylity. We’ve got you covered:
Setup
Our experts will guide you through the setup process. Step by step.
Training
We’ll get your team up to speed. Fast.
Support
Questions? Problems? We’re here for you, 24/7.
But we’re not just about onboarding. We’re committed to your ongoing success. Continuous improvement is our mantra. We listen to your feedback. We refine our solutions. We grow with you.
Welcome to the Xylity family.
Get in Touch
USA
24610 Durindal Ter,
Sterling, VA 20166, USA.
India
3rd Floor, 340 F-AD
Scheme 74-C, Vijay Nagar, Indore – 452010, M.P
Poland
Bronowicka 17A,
Krakow 30-084
Germany
Bleicheroder Straße 13, 13187,
Berlin, Germany
