Break down data walls. Make informed decisions with Xylity’s BI solutions. We help nonprofits navigate data complexity. See your mission impact. Make a difference with data.
Unlock Your Data's Potential for Social Good
The Need for BI & Analytics in the Nonprofit Sector
We know nonprofits face uphill battles—limited budgets, overworked staff, increasing competition. But you persist, driven by your mission. What if using data could ease your burden? With advanced analytics, you can transform scattered information into powerful insights that improve fundraising, programs, and operations. Data-driven decisions become possible. This is why nonprofits need cutting-edge business intelligence solutions like Xylity. We’re here for you, ready to help you unlock the potential within your data to expand your reach and deepen your impact. The future is bright when nonprofits have the tools to harness data for good.


Are Data Headaches Holding You Back?
Data Challenges in Nonprofits: Understanding the Problem
Imagine vital donor details trapped in outdated spreadsheets. Fundraising campaign metrics split across disjointed reports. Key program data siloed in different databases. This is the reality for many nonprofits. Important information gets scattered across various systems and forgotten. Overworked staff lack tools to extract insights. There’s minimal visibility to guide decisions. Fundraising suffers. Programs lag. Operations stay inefficient. But it doesn’t have to be this way. At Xylity, we intimately understand these data challenges plaguing nonprofits because we’ve helped leading organizations overcome them. With robust, purpose-built analytics, you can transform fractured data into unified insights that steer growth and social impact. Let Xylity help you break through data bottlenecks so you can focus on changing lives.
From Data to Insights: The Xylity Advantage
Transforming NPO Data into Actionable Insights with Xylity
At Xylity, we don’t just implement technology. We guide you on a journey—from disconnected data to unified insights. Our end-to-end approach includes:
- Intelligent Data Integration – We connect data from your various systems into our advanced analytics engine. Siloed information becomes whole.
- Smooth Data Transformation – Our algorithms structure, cleanse and enrich your raw data, ensuring accuracy and reliability for analysis.
- Impactful Data Visualization – We turn enriched data into intuitive interactive dashboards with charts, graphs and custom visuals. Insights emerge.
With these capabilities tailored for NPOs, you can:
- Track donor engagement across channels
- Analyze performance of fundraising campaigns
- Assess volunteer participation rates
- Monitor program budgets and expenses
- Forecast future funding needs
The power of data becomes your power to better serve communities. Let Xylity be your guide, equipping you with the analytics capabilities to gain value from your data. The potential for social good is boundless.
Know Your Donors, Grow Their Impact
Donor Analytics & Management
Donors are the lifeblood of any nonprofit. With Xylity, understand your donors deeply so you can inspire them to give generously in support of your mission.
Our donor analytics solution provides
- Demographic insights – Age, location, interests, wealth indicators
- Engagement tracking – Event participation, email opens, site visits
- Loyalty measurement – Recency, frequency, lifetime value
- Channel preference – Direct mail, email, social medi
Key features
- Dynamic donor profiling based on interests
- Automated stewardship journeys to nurture donors
- Personalized communication tailored to donor attributes
- Predictive models to identify new donor prospects
With data-driven donor relationship management, you can
- Acquire new recurring donors more efficiently
- Retain existing donors longer through relevant engagement
- Grow the lifetime value of profitable donor segments
- Turn one-time givers into regular contributors
Maximize Every Dollar Raised
Fundraising Optimization
Make every fundraising effort count with data-driven optimization from Xylity:
Performance Tracking
Performance Tracking
- Results by campaign, channel, audience
- Cost per dollar raised metrics
- ROI analysis for resource allocation
Effectiveness Analysis
- Response rate, conversion rate analytics
- Donor sentiment analysis
- A/B testing of campaigns
Revenue Forecasting
- Models to predict campaign potential
- Set goals aligned with projections
- Scenario planning capabilities
Features
- Multichannel attribution to quantify impact
- Automated personalized nurture journeys
- Recommendations to improve performance
Benefits
- Increased funds raised with optimized spend
- Improved utilization of high-performing channels
- Donor-centric experiences to drive loyalty
Double your fundraising ROI with optimization powered by Xylity.
Measure Your Mission Progress
Program Analytics
Furthering your organization’s mission is the ultimate objective. With Xylity, gain clarity into your programs’ effectiveness through robust analytics.
Effectiveness through robust analytics.
- Track program budgets, expenses, and benchmarks.
- Monitor key impact metrics like clients served.
- Assess performance against goals.
- Identify high and low performing programs.
Our solution empowers you to
- Quantify your mission impact with reliable data.
- Continuously improve program outcomes.
- Optimize spending based on program ROI.
- Convey your impact visually to stakeholders.
Key features include
- Customized dashboards for each program.
- Scheduled KPI reporting for stakeholders.
- Comparative analysis across programs.
- Models to forecast program capacity.
Make every program dollar count. Let Xylity provide the analytics to maximize your mission impact.
Inspire Your Volunteers to Do More
Volunteer Management
Rally your volunteers to drive impact with better management enabled by Xylity.
Track volunteer hours across programs
- Track volunteer hours across programs.
- Monitor participation rates in events.
- Identify low-engagement volunteers for outreach.
- Schedule volunteers based on program needs.
Our robust analytics provide
- Profiles of highly engaged volunteers.
- Recommendations to boost participation.
- Attrition risk analysis to improve retention.
- Skills gap analysis for better job matching.
Benefits include
- Improved volunteer productivity.
- Higher volunteer satisfaction.
- Increased volunteer lifetime value.
- Reduced administrative overhead.
Get the insights to keep your volunteers inspired. Let Xylity maximize their impact.
Xylity’s approach on attrition risk analysis and skills gap analysis for volunteer management:
Attrition Risk Analysis
- Analyzes past volunteer retention patterns to identify risk factors like low engagement, poor job matching etc.
- Scores volunteers based on attributes like hours contributed, tenure, participation levels to flag high attrition risks
- Enables targeted outreach to high-risk volunteers to boost satisfaction and retention
- Provides insights to improve volunteer onboarding and management to lower future attrition
Skills Gap Analysis
- Creates skills profiles for volunteers based on past experience, abilities, interests etc.
- Maps volunteer skills profiles against requirements for programs and events
- Identifies gaps where volunteer skills don’t fully match program needs
- Matches high-skilled volunteers to complex tasks to utilize them better
- Highlights opportunities for additional volunteer training to address skills gaps
- Enables better job-volunteer fit to boost engagement and productivity
This advanced analytics provides actionable insights to optimize volunteer recruitment, management and retention.
Xylity Dashboards for Nonprofits
Amplify Your Logistics with Our Advanced Dashboards
Transform scattered data into unified insights with Xylity’s interactive dashboards for nonprofits.
Donor Dashboard:
With our donor dashboard, you can:
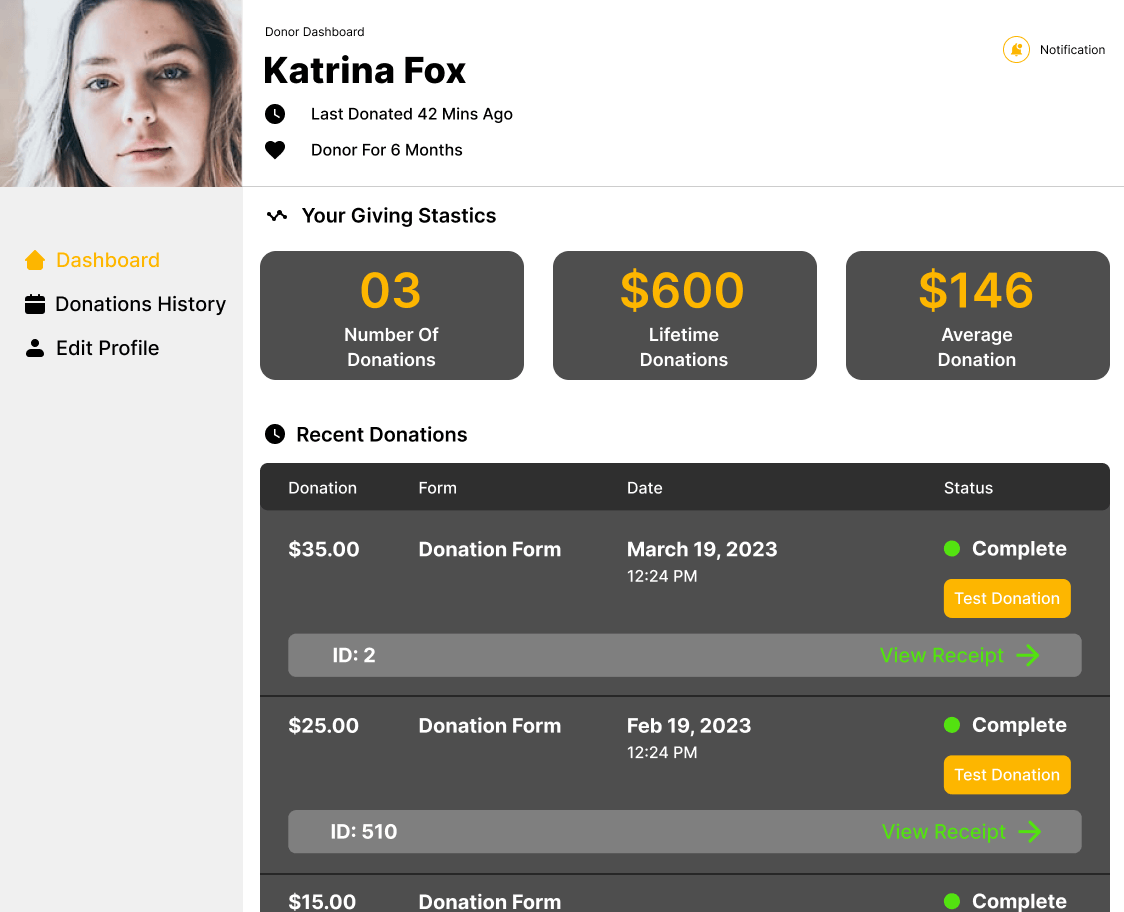
- View Your Giving Statistics at a Glance: See the total number of your donations, lifetime amount donated, and average gift size—all in one place.
- Stay Up To Date with Recent Donations: Our dashboard highlights your latest donations with the amount, date, and current status. No more guessing if your gift went through.
- Access Your Full Donation History: Check your complete record of donations made over time. Easily page through your giving history whenever you need it.
- Edit Your Donor Profile with Ease: Update your name, contact information, or giving preferences through the sidebar profile editor. We make profile management simple.
- Track Your Impact: With data-rich insights into your donations, you can better understand the difference your generous support makes over time.
Program Dashboard:
Analyze Events Like a Pro
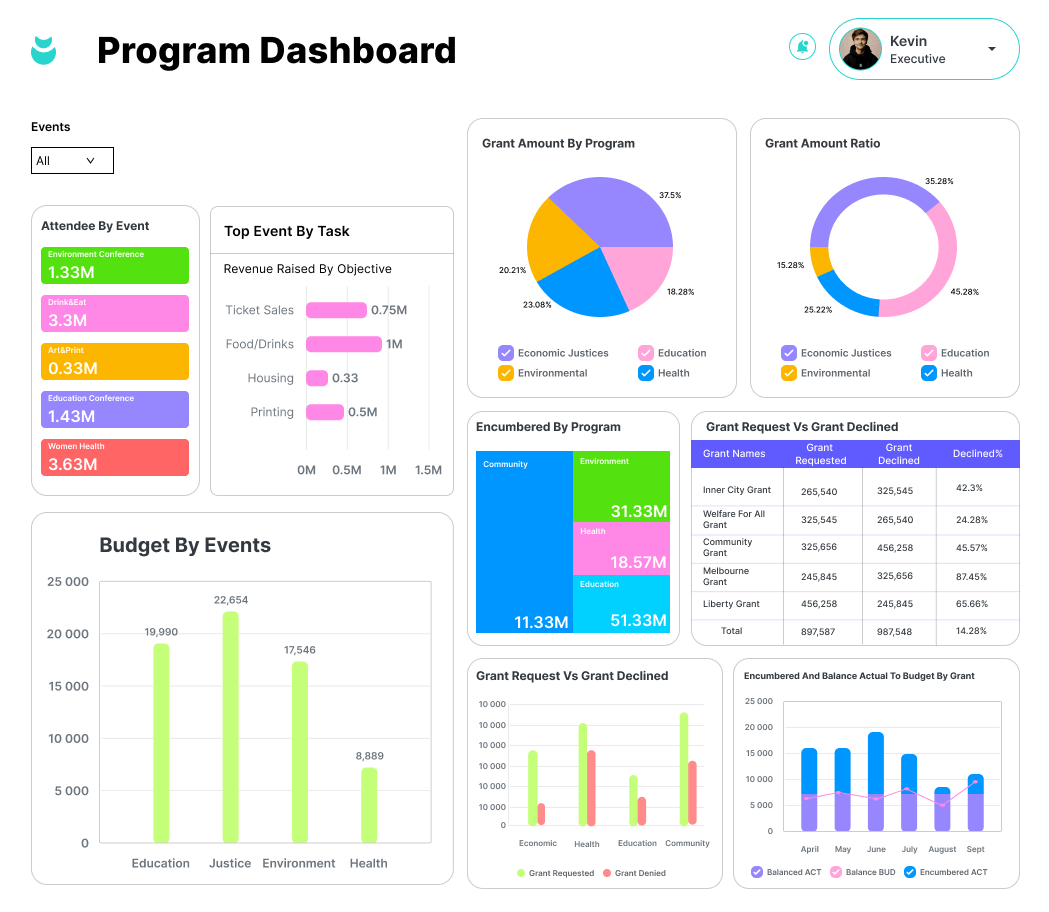
- See event attendance numbers at a glance with charts categorized by event type. Identify your most and least popular events.
- Assess budget distribution across your top 5 events using helpful line charts.
- View the percentage of total costs for each event type in easy-to-read pie charts.
Follow Grants Closely
- Use bar charts to monitor grant amounts awarded to your different programs.
- View what percentage of your total grant money is allocated to each program.
- Compare grant requests versus awarded amounts per program via line charts.
Get the Full Picture
- See at-a-glance overviews of grant budgets and balances for all your programs.
- Track how grant requests and awards align across every program in one view.
Financial Dashboard:
Managing company finances efficiently is crucial for success. Our specialized financial dashboards provide the real-time insights you need to make data-driven decisions.
With our dashboards, you can:
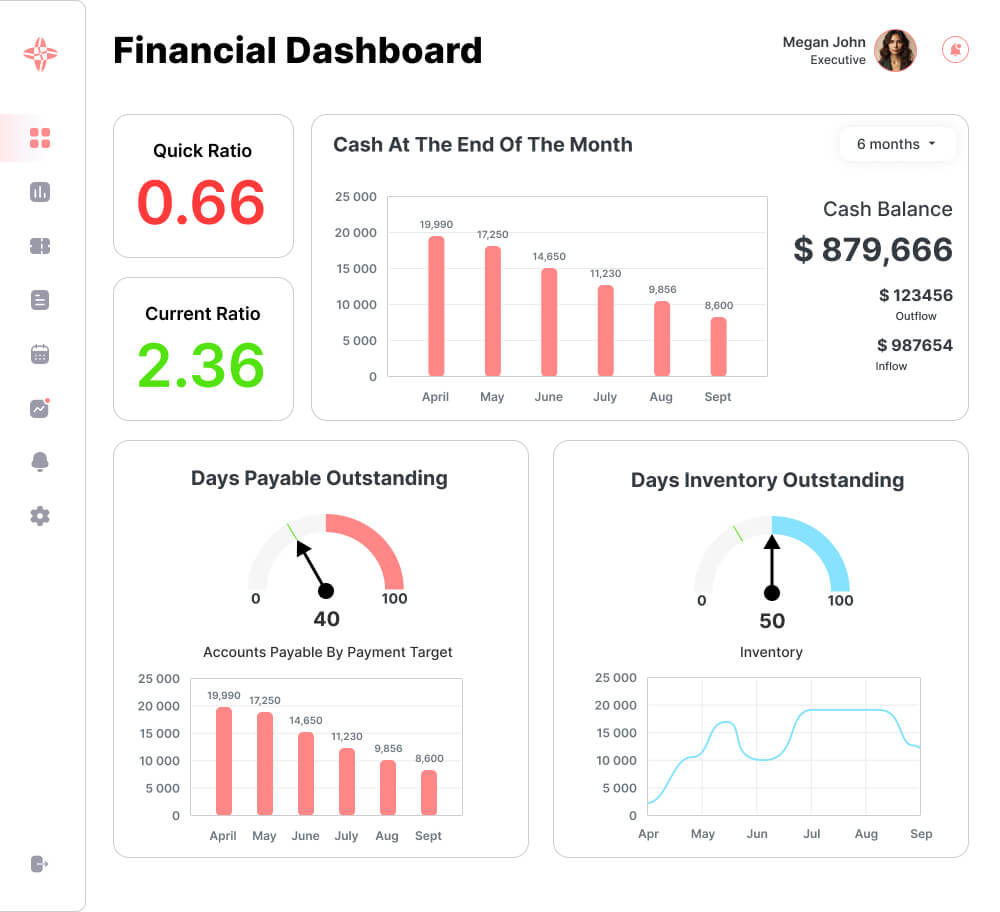
- Monitor Cash Flow: View cash balance at a glance with helpful bar graphs. Stay on top of your available liquidity.
- Assess Financial Health: Track important ratios like current ratio, quick ratio, and days sales outstanding using easy-to-read half circle graphs. Identify issues early.
- Optimize Inventory: Use bar charts to follow inventory turnover metrics. Spot trends and find improvement opportunities.
- Manage Payables: Half circle graphs display accounts payable outstanding. Ensure you’re managing supplier payments effectively.
- Analyze Receivables: Bar graphs show accounts receivable turnover rates. Identify any customer payment delays quickly.
Financial clarity is a huge advantage. Our specialized dashboards transform complex financial data into clear, actionable insights. See how you can optimize financial performance with real-time analytics at your fingertips.
Volunteer Dashboard:
Understanding your volunteer engagement is key for nonprofit success. Our intuitive volunteer dashboards provide real-time analytics so you can optimize volunteer programs.
With our dashboards, you can:
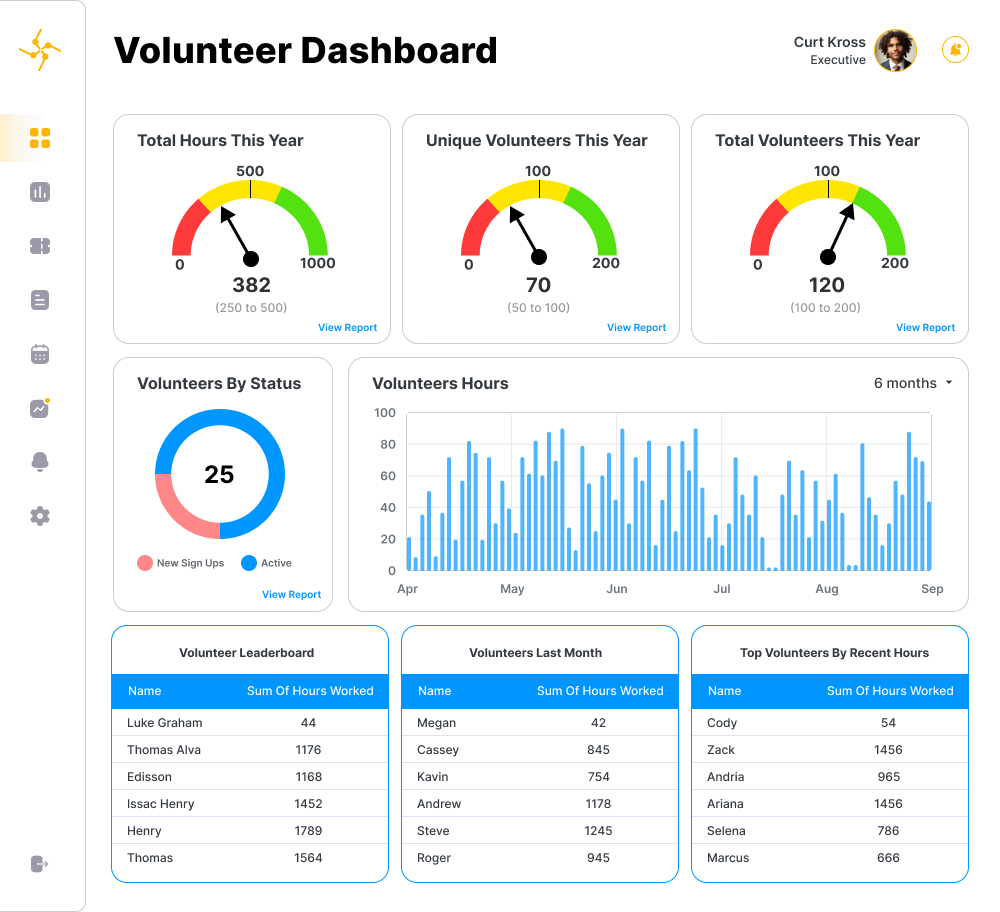
- Track Top Volunteers: See who your most dedicated volunteers are on the leaderboard. Recognize and reward them.
- Monitor Volunteer Hours: Follow total hours year-to-date, by month, and by state. Spot trends and set goals.
- Analyze Volunteer Numbers: View total and unique volunteers year-to-date, by month, and by state. Identify growth opportunities.
- Compare Metrics Visually: Charts, graphs, gauges, maps, and lists present data clearly. See insights at a glance.
- Identify What’s Working: Determine which states and months have the highest engagement. Repeat success across all your programs.
- Make Data-Driven Decisions: Backed by real-time analytics, allocate resources optimally to drive volunteer participation.
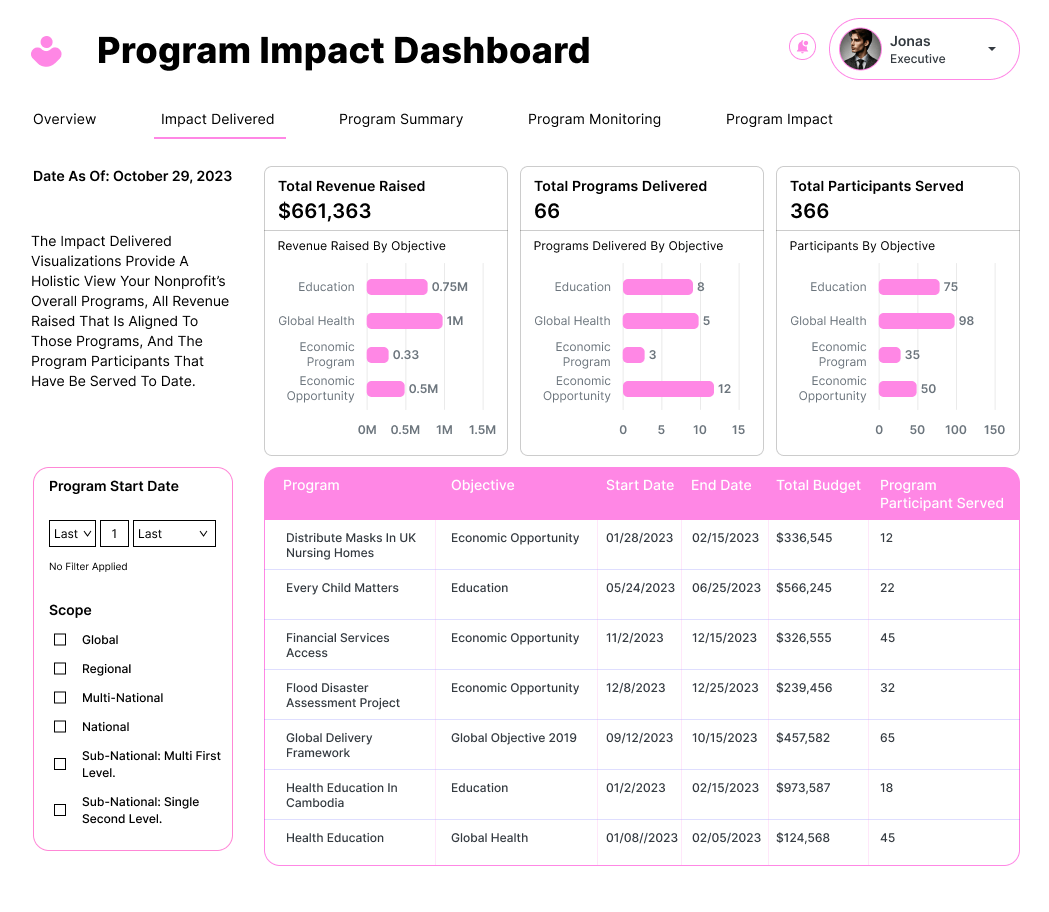
Impact Dashboard
Understanding your program’s impact is crucial for demonstrating outcomes. Our interactive impact dashboards provide real-time analytics so you can optimize programs and report progress.
- See Program Timeframes: View start and end dates, ensuring alignment with goals.
- Assess Progress: Follow percentage of participants served against targets. Identify gaps to refine strategies.
- Monitor Spending: Track budgets versus actuals, making informed decisions about resource allocation.
- Validate Data: Note data versions and dates, ensuring accuracy and relevance.
- Report Outcomes: Show quantitative results and milestones reached backed by data.
Whether it’s for internal improvement or external reporting, our dashboards transform metrics into meaningful insights. We make program impact assessment easy and effective.
With Xylity’s tailored dashboards aligned to your mission, you gain:
- A single source of truth
- Data-driven decision making
- Improved reporting and visibility
- Enhanced operational efficiency
- Strategic insights to accelerate success
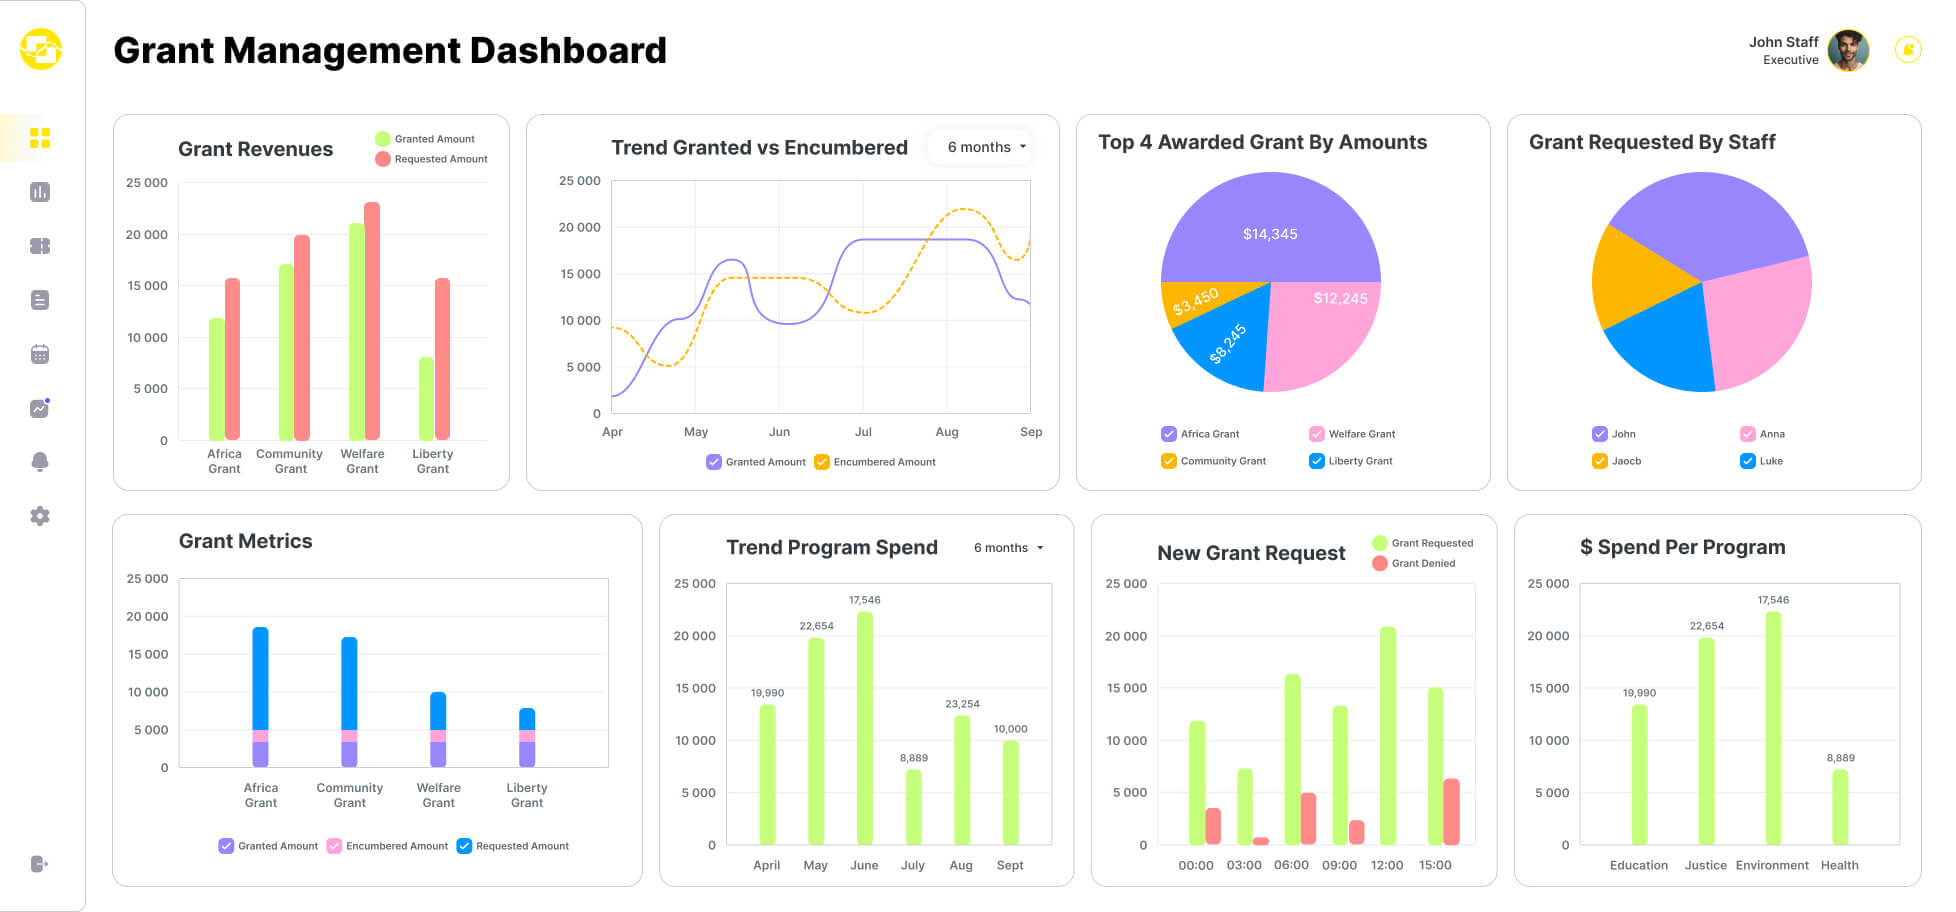
Grant Management Dashboard
Effectively managing grants is key to driving impact. Our intuitive grant dashboards provide real-time analytics so you can make data-driven decisions.
With our dashboards, you can:
- Track Revenue Trends: Monitor grant revenue over time with line graphs. Forecast income more accurately.
- Control Expenses: Follow grant spending closely with line graphs. Ensure alignment with budgets and goals.
- Analyze Grant Sources: See grant breakdowns by amount using pie charts. Identify and pursue high-potential funders.
- Assess Grant Metrics: Use bar charts to compare metrics like proposals submitted, approved, and denied.
- Monitor Program Spending: View allocated budgets by program in tables. Adjust distributions based on performance.
Whether you’re a grantor or grantee, our dashboards provide clarity. We transform your grant data into visualizations that lend meaningful insights. Discover how our dashboards can help you maximize impact and funds under management.
Accelerating Missions with Data-Driven Insights
Nonprofits Transformed with Xylity Analytics
At Xylity, we take pride in empowering nonprofits to further their mission with data. Here are examples of the impact we’ve driven:
Arts Nonprofit boosted donor retention 15% with targeted stewardship campaigns.
Housing Nonprofit optimized volunteer schedules, improving capacity utilization 24%.
Youth Nonprofit increased program enrollment 26% after identifying growth opportunities through location analysis.
Animal Welfare Nonprofit cut operational costs 12% by consolidating underperforming shelters identified in their dashboard.
Education Nonprofit improved grant application success rate from 24% to 68% by showcasing their impact with Xylity’s analytics.
These are just some of the real-world examples of how Xylity equips nonprofits to derive strategic value from their data. Let us help you transform yours. With advanced analytics, you can gain visibility, efficiency and insights to accelerate your mission.

Accelerate Your Mission with Optimized Operations
Streamlining Operations and Achieving Efficiencies with Xylity
At Xylity, we understand nonprofits need to make every dollar and minute count. Our BI and analytics solutions help streamline your operations for maximum efficiency. Automated, scheduled reporting reduces manual workloads. Staff gain insights to work smarter. Resources get optimized based on data. With time and effort saved, you can reallocate your precious resources towards furthering your mission. Partnering with Xylity means leaner operations, empowered employees, and accelerated impact.
Get in Touch
USA
24610 Durindal Ter,
Sterling, VA 20166, USA.
India
3rd Floor, 340 F-AD
Scheme 74-C, Vijay Nagar, Indore – 452010, M.P
Poland
Bronowicka 17A,
Krakow 30-084
Germany
Bleicheroder Straße 13, 13187,
Berlin, Germany
